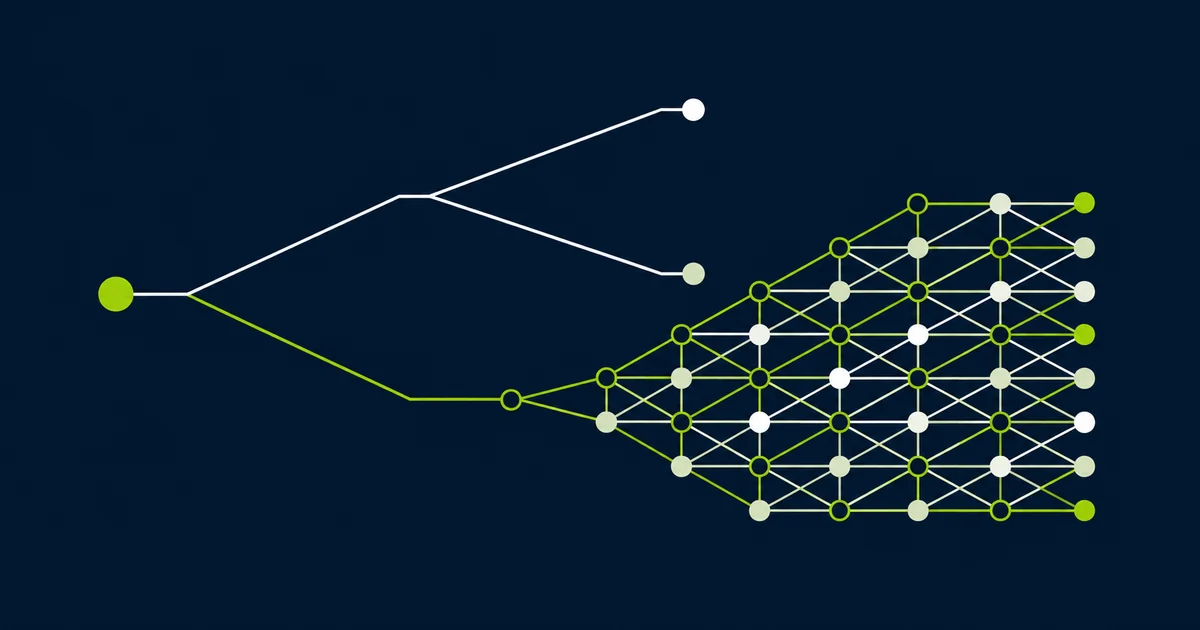
Every experimentation vendor ranks on this comparison, and most of them answer it with a sales pitch. The honest answer, when choosing between A/B testing and multivariate testing, depends on three numbers: your traffic, your baseline conversion rate, and how much you believe your page elements interact. This post gives you the decision framework, with the math shown.
01What each design actually measures
An A/B test asks one question: does the whole experience on page B beat the whole experience on page A? Everything that differs between the two (headline, image, button, layout) moves as a bundle, and the test returns a single verdict on that bundle. It cannot tell you which piece of the bundle did the work, and it cannot tell you whether two pieces reinforced or cancelled each other, because it never separated them in the first place.
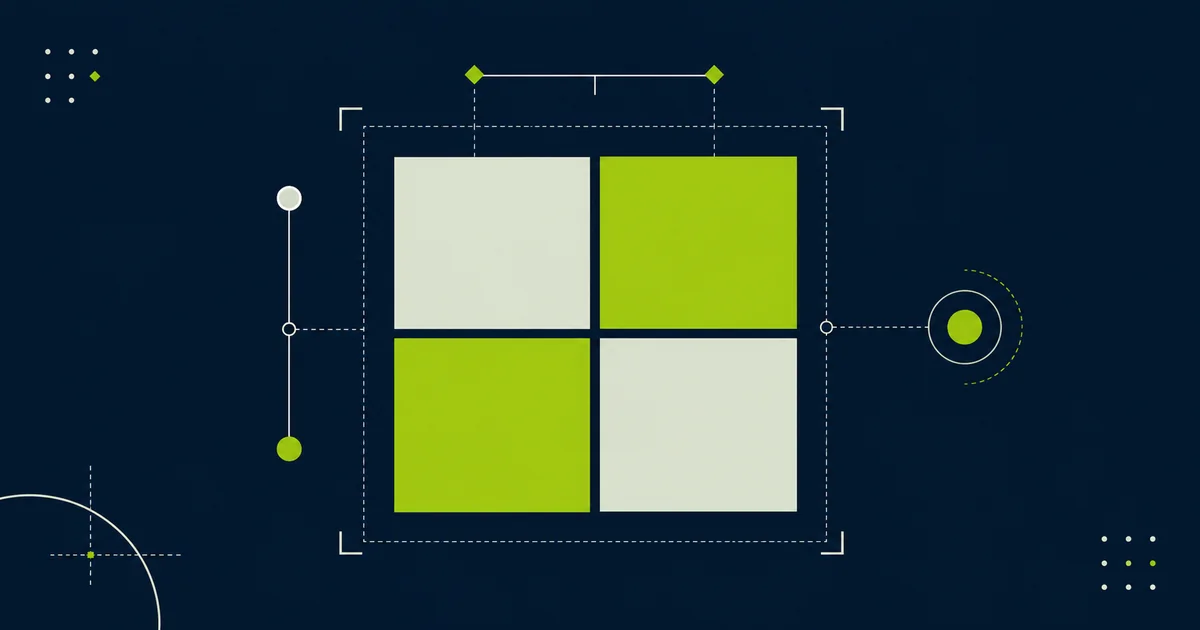
A full-factorial multivariate test asks a different, larger question. It builds every combination of every level of every factor (a headline with two options crossed with a CTA with two options is four combinations, a 2×2) and randomizes traffic across all of them. That buys you two things an A/B test structurally cannot produce: a main effect for each factor on its own (does the new headline help, averaged across both CTAs?) and an interaction effect (does the new headline only help when paired with the new CTA, or does it actively hurt with the old one?). Adobe and Optimizely's own documentation for their MVT products makes the same distinction: MVT estimates element-level influence and is the tool built specifically to surface interactions, which is exactly the thing A/B was never designed to see.
"Test one thing at a time" is good advice for isolating a single cause when you only have the budget for one comparison; it is not a statistical law. It's a rule of thumb from an era of low-traffic testing where running a factorial design responsibly wasn't affordable. The real constraint was never methodological purity; it was sample size, which is the subject of the next section.
02The sample size penalty, quantified
Here's the arithmetic, using a baseline conversion rate of 5%, a target lift to 6% (a 1-percentage-point absolute move), and 80% power throughout: standard proportion-test formulas, Bonferroni-corrected for the multiple combination-vs-control comparisons a factorial design implies. A plain two-arm A/B test needs about 8,158 visitors per arm at α = 0.05 (16,316 total), rising to 12,139 per arm (24,278 total) at the stricter α = 0.01.
Move to a full factorial and the total climbs fast, because each additional cell both dilutes traffic per cell and adds another comparison that has to clear a stricter, Bonferroni-adjusted bar. A 2×2 design (4 cells, 3 combination-vs-control comparisons) needs about 43,528 total visitors at α = 0.05 (2.7x the A/B figure). A 3×2 design (6 cells) needs about 72,834 (4.5x). A 3×3 design (9 cells) needs about 119,628 (7.3x). At α = 0.01 the multiples hold roughly steady: 59,308, 96,414, and 154,872 respectively. That "4-8x the traffic" range is not a rule of thumb: it's what the same formula produces as you add cells.
One nuance saves the picture for main effects: if what you actually want is "does this one binary factor move the needle on average, ignoring what it's paired with," that's just the pooled two-arm contrast again, and it costs about the same as a plain A/B test (16,316 total at α = 0.05) regardless of how many other factors sit in the design. The expensive part is specifically the demand to identify one winning combination out of many, and worse, the demand to detect an interaction. A 2×2 interaction of modest size (an additive interaction of +1 percentage point beyond what the two main effects predict) needs about 67,988 total visitors to detect at α = 0.05, more expensive than resolving the combination winner outright. A large interaction (4 percentage points) is comparatively cheap to find, at around 4,420. Interactions are powered by the size of the difference-of-differences, not the size of either main effect, so a subtle interaction can be the single most expensive thing you try to measure on a page.
The middle path is a fractional factorial: instead of running every combination, you run a carefully chosen subset that still estimates main effects (and sometimes low-order interactions) at a fraction of the traffic cost, at the price of assuming some higher-order interactions are negligible. It's the right compromise when you have more than two or three factors you care about but don't have six-figure-per-page traffic to spend on the full cross-product.
03Interactions A/B testing structurally cannot see
Take a synthetic but realistic case: two binary factors, A and B, with true cell conversion rates of 5% (neither), 7% (A alone), 7% (B alone), and 5% (both). The marginal effect of A, averaged over both levels of B, is exactly zero. So is the marginal effect of B. Run either as a standalone A/B test and you conclude "no effect" on both; you'd be right about the average, and wrong about what's actually happening. The interaction term here is a full -4 percentage points: each factor only helps when the other is absent, and combining them cancels the gain entirely. In a simulated run of this scenario with 8,000 visitors per cell, the pooled A effect came back not significant (p ≈ 0.21), the pooled B effect not significant (p ≈ 0.22), and the interaction contrast overwhelmingly significant (p < 10⁻¹³). Two "failed" A/B tests were sitting on top of a real, large, detectable effect the whole time.
A second case shows the opposite failure mode: not a false null, but a badly underestimated win. Cell rates of 5% (neither), 6% (A alone), 6% (B alone), 10% (both): each factor tested alone against control shows a +1 point lift, so an additive model predicts the combined experience should convert around 7%. It actually converts at 10%: a 3-point positive synergy the two separate A/B tests never would have predicted, because nothing in either isolated test measures what happens when both changes ship together.
These aren't hypothetical. Published case studies rarely disclose formal interaction coefficients, but they consistently disclose winning combinations that no sequence of isolated A/B tests would have found, because the winner wasn't the sum of the individually-best pieces. Obama's 2008 campaign splash-page test crossed 4 button variants against 6 media options (24 combinations, 310,382 visitors, roughly 13,000 per cell) and the team's own creative preference (a video) lost to every single image option; the winning combination (a "Learn More" button with a family photo) lifted sign-up rate from 8.26% to 11.6%, a 40.6% relative gain, and it only surfaced because images and videos were tested against every button rather than each element being A/B'd in isolation. Hyundai Netherlands ran a 2×2×2 (copy, an extra CTA, image size) and the winning combination lifted lead conversion 62% and step click-through 208%. Provident Hotels & Resorts crossed 3 form-title variants with 4 CTA texts (12 combinations, 27,500 visitors over a month) and the winner was a specific title-CTA pairing ("Reserve a Room" plus "Search") delivering a 9.1% CTR lift: a pairing, not a standalone element, that an isolated test of titles or CTAs alone would not have surfaced as such. Microsoft's Office landing-page MVT across hero shot, title, description, CTA, and resource links found a best combination worth a 40% conversion lift and explicitly attributed the gain to how the elements interacted, not just their individual strength.
04A decision framework by traffic volume
Convert the sample-size math into calendar time and the decision mostly makes itself. Below roughly 1,000 visits/day on the specific page you're testing, a full-factorial 2×2 takes 44-87+ days to reach the visitor counts above: long enough that seasonality, traffic-mix drift, and plain impatience will corrupt the result before it finishes. At that volume, A/B (16-33+ days) is not just simpler, it's the only design that finishes while the answer still matters. Treat full-factorial MVT here as a special case you reach for only with an unusually strong, specific interaction hypothesis, not a default.
In the 1,000-10,000 visits/day band, sequential A/B remains the right default; a 2×2 becomes worth considering only on your single most important page, with a clear a priori interaction hypothesis and tolerance for a multi-week test. From 10,000-100,000 visits/day, 2×2 and some 3×2 designs become genuinely practical (a 2×2 finishes in under a week even at the low end of that band), so this is the range where a fractional factorial across 2-3 factors, or a careful full factorial on your highest-value page, starts to earn its complexity.
Above 100,000 visits/day, full-factorial MVT is operationally cheap (a 3×3 finishes in about a day), but the risk shifts from "not enough traffic" to "too many ideas": vendor guidance from Adobe, Optimizely, and VWO all converge on the same warning that adding low-impact factors to a design only dilutes the traffic available to the factors that matter, and Optimizely specifically flags trouble managing designs beyond roughly 25 combinations. At this volume, the constraint isn't power, it's discipline: keep the factor set small and hypothesis-driven, and treat "we have the traffic" as necessary, not sufficient. Above the full-factorial-practical threshold, a bandit-style allocation strategy (shifting traffic toward better-performing arms as the test runs, rather than holding a fixed allocation for the full duration) becomes the natural next step for continuously optimizing high-traffic pages, though it trades off the clean, one-shot statistical read a fixed-horizon factorial test gives you.
One rule holds regardless of band: if you can't defend the combination count, the expected duration, and the interaction hypothesis in advance, default to A/B. Undersized full-factorial tests don't fail loudly: they fail by handing you a noisy "winner" you can't actually trust.
05How TraqLyte models this
TraqLyte's data model is built around this exact distinction rather than bolting MVT on as an afterthought. A Campaign has one or more Factors (your dimensions, like CTA color or headline copy) and each factor has one or more Variants, the concrete values it can take. A Cohort is a locked combination of variants, one per factor, and cohorts are what users actually get assigned to. Run a single factor with two variants and you have a plain A/B test. Add a second factor and TraqLyte's generate_full_factorial_cohorts() builds the full cross-product of variants into cohorts automatically (a 2×2 becomes 4 cohorts, a 3×3 becomes 9), which is the same full_factorial assignment strategy underlying every calculation in this article.
That gives you an honest read on where TraqLyte sits today: full-factorial designs are a first-class, working capability: factors and variants as real objects, cohorts as their cross-product, assignments locked to a specific campaign version so history stays trustworthy even as you keep iterating. Fractional-factorial designs, which this article recommends as the middle path once you're past two or three factors but short of full-factorial traffic, and bandit-style adaptive allocation, useful once you're well past the full-factorial-practical threshold, are both named in TraqLyte's ASSIGNMENT_STRATEGIES as intended strategies but are not implemented yet. If your factor count and traffic put you in fractional-factorial or bandit territory today, plan around full-factorial or sequential A/B on TraqLyte in the meantime: that's the honest current boundary, not a hidden one.
Sources
- Adobe Target documentation: traffic-estimator methodology, 95%-confidence/80%-power planning convention, and guidance on scoping MVT to page-level traffic.
- Optimizely MVT and interaction-effects documentation: definition of full-factorial testing, the ~25-combination practical ceiling, and worked intuition on how paired changes can under- or over-perform their sum.
- VWO success stories and educational content: MVT positioning for beginners vs. hyper-optimization, and multiple published case studies with disclosed traffic and lift figures.
- Webtrends full-factorial MVT guidance: recommendation to reserve full-factorial designs for traffic-rich sites with small combination arrays.
- JAMA review of factorial clinical trial design: the general finding that trials powered for main effects are frequently underpowered for interaction effects.
- NIST Engineering Statistics Handbook: normal-approximation sample-size formulas for two-proportion tests (7.2.4.2, and Bonferroni's method at 7.4.6.3) used throughout this article's calculations.
- Statsmodels documentation (`FTestAnovaPower`) and Minitab full-factorial power examples: balanced-ANOVA power approximation used for the three-level factor main-effect calculation.
- Harvard interaction-effects tutorial and Penn State logistic-regression course notes: additive vs. multiplicative interaction framing and the log-odds interpretation of interaction coefficients.
- Optimizely's official Obama 2008 campaign retrospective: the 24-combination splash-page test (310,382 visitors) and its 40.6% sign-up-rate lift.
- MarketingExperiments (Vertster) case briefs: multi-element micro-test and e-commerce product-page MVT results, including the background-color and CTA element-effect figures.